

Every time the group draw for soccer World Cups is finished, fans and pundits label one group “The Group of Death”. The term is so big it even has a Wikipedia page and is present in the Cambridge Dictionary! But is this a real phenomenon or just another sports cliché?
I’ve decided to find out (with some help from LLMs) by digging deep and checking whether “Group of Deaths” are as unpredictable as their reputation suggests. I’ve used two different methods to figure it out: one objective approach that’s based on FIFA Rankings and a subjective one that’s based on public perception.
Both proved that “Group of Deaths” are as scary as the name sounds, so let’s start with a few spoilers.
Key Takeaways
- Favorites in “Group of Deaths” determined by FIFA Official Rankings and public perception are eliminated way more often than favorites in regular groups, suggesting the term is legit and not just a cliche.
- Secondary favorites in “Group of Deaths” are eliminated 62.5% of the time compared to 37% in regular groups, if you go by FIFA Rankings.
- There was not a single instance of both favorites getting eliminated from a regular group, compared to 15% (FIFA Rankings) and 2% (public perception) in “Groups of Death”.
- Public perception might be the better way to determine the “Group of Death”, as it was the best indicator of the main favorite getting eliminated (42.9% of the time).
- At least one favorite was eliminated from the “Group of Death” over 70% of the time for both methods, compared to under 60% for other groups
What Is a “Group of Death”?
Let’s start with a clear definition of the term. The official website of the Cambridge Dictionary features the following one “in the first stage of a football cup competition, a group containing several of the best teams in the competition, not all of whom can move onto the next stage”.
While this is not exclusive for the soccer World Cup, the Group of Death Wikipedia page suggests that the term’s origins can be traced to the 1970 FIFA World Cup.
Overall, this is a group with very strong teams that all have the potential to progress, but someone has to be eliminated because of the tournament format.
In theory, this is not supposed to happen in World Cup finals because the draw features seeding and regional limitations. However, there’s always one group that we label as the “Group of Death”, so in practice, it happens all the time!
At least, it did before 2026, but more on that in the conclusion.
1. Group of Death Data: FIFA World Ranking Method
For this method, I calculated the mean FIFA Rankings of all groups in each tournament since the ranking system was introduced in 1992. The one with the lowest mean rankings in each tournament was determined as the “Group of Death”, while all other groups are just regular groups.
I also determined the favorites to progress from each group based on the rankings. The two teams with the highest rankings were labeled favorites for each group.
I split the favorites into two types: main favorite (team with highest ranking) and secondary favorite (team with second-highest ranking). I provide data for how often each was eliminated in group of deaths vs. regular groups, as well as how often both were eliminated.
The 8 tournaments featured a total of 62 groups, including 8 “Groups of Death”. Here’s what the results show us:
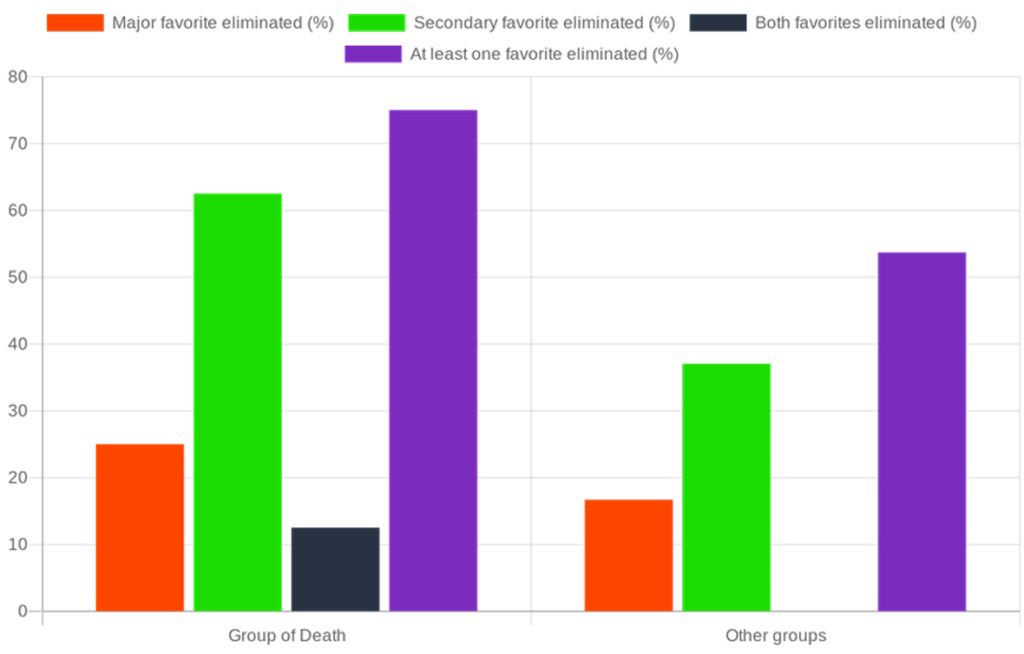
Based on the results, the “Group of Deaths” determined by this method absolutely delivered! Here’s a quick breakdown:
Key results
- Major favorite eliminated: 25% (2/8) in the Group of Death; and only 16.7% (9/54) in other groups.
- Secondary favorite eliminated: 62.5% (5/8) in the Group of Death; only 37.0% (20/54) in other groups.
- Both favorites eliminated: 12.5% in the Group of Death (1/8); and 0% in other groups.
- At least one favorite eliminated: 75.0% (6/8) in the Group of Death; 53.7% (29/54) in other groups.
So, yeah, the “Group of Death” phenomenon is 100% real if you go by FIFA Rankings, as the favorites are eliminated significantly more often compared to other groups.
For the record, FIFA rankings use an ELO method to evaluate each team. You can find the full methodology and how it changed throughout the years on the Wiki page on the FIFA Rankings.
2. Group of Death: Public Perception
For that second method, I had a bit of a problem. Finding publications about “Groups of Death” was fairly easy for all tournaments, as you will see in the sources below. However, I had to pick favorites in each group, so I decided to go by FIFA Rankings once again.
While this leads to some level of crossover with the other method, it was the best objective way possible to determine favorites I could think of.
What I did was simple: I picked the “Group of Death” based on media publications and then checked how the favorites did compared to other groups:
Key results
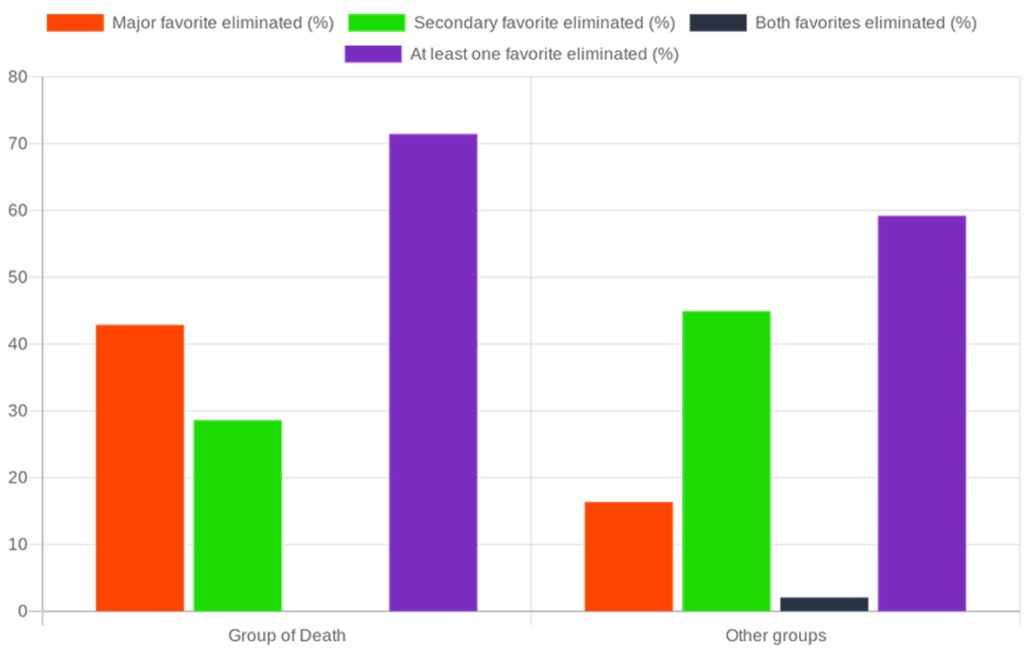
- Major favorite eliminated: 42.9% (3/7) in the Group of Death; 16.3% (8/49) in other groups.
- Secondary favorite eliminated: 28.6% (2/7) in the Group of Death; 44.9% (22/49) in other groups.
- Both favorites eliminated: 0 in the Group of Death; roughly 2% (1/49) in other groups.
- At least one favorite eliminated: 71.4% (5/7) in the Group of Death; 59.2% (29/49) in other groups.
The results here are very interesting, as the major favorite was eliminated almost half the time in Group of Deaths, way more often compared to other groups!. The secondary favorite, however, was eliminated 28.6% of the time compared to 44.9% of the time in other groups.
While this might seem odd at first, it actually makes sense. Every single time the major favorite is eliminated, it means at least two of the other three teams make it. And since the main favorite is out so often, the secondary one is more frequently among the nations that progress to the next round.
This becomes clear where you check the “at least one favorite” eliminated data. It shows that at least one of the favorite was out 71.54% of the time!
Sources
1998 FIFA World Cup
- https://en.wikipedia.org/wiki/1998_FIFA_World_Cup_Group_D
- https://www.si.com/soccer/2010/06/09/09-2groups-of-death-in-world-cup-history
2002 FIFA World Cup
- https://en.wikipedia.org/wiki/2002_FIFA_World_Cup_Group_F
- https://www.si.com/soccer/2010/06/09/09-2groups-of-death-in-world-cup-history
2006 FIFA World Cup
- https://en.wikipedia.org/wiki/2006_FIFA_World_Cup_Group_C
- https://www.si.com/soccer/2010/06/09/09-2groups-of-death-in-world-cup-history
2010 FIFA World Cup
- https://www.sbnation.com/2009/12/4/1185764/your-2010-group-of-death-group-g
- https://en.wikipedia.org/wiki/2010_FIFA_World_Cup_Group_G
2014 FIFA World Cup
- https://abcnews.go.com/Sports/world-cup-2014-us-advance-group-death/story?id=24257709
- https://en.wikipedia.org/wiki/2014_FIFA_World_Cup_Group_G
- https://www.bigsoccer.com/forums/group-g-germany-ghana-usa-portugal.1606/
2018 FIFA World Cup
- https://www.cbssports.com/soccer/news/2018-fifa-world-cup-which-teams-are-pitted-in-the-group-of-death-in-russia/
- https://fansided.com/2018/06/11/world-cup-2018-group-f-preview-germany-mexico-sweden-south-korea/
- https://www.quora.com/Which-group-can-be-considered-as-the-group-of-death-of-the-FIFA-World-Cup-2018
- https://sports.stackexchange.com/questions/18649/fifa-world-cup-2018-group-f-qualification-scenarios
2022 FIFA World Cup
How to Determine Whether This Is a Real Phenomenon or Just a Cliché? (Methodology)
In theory, a “Group of Death” should be competitive and unpredictable since all teams are strong and have their chances to progress to the next stage. By that logic, favorites in such groups should be eliminated more often than other groups.
It’s a simple but efficient concept, so I decided to compare World Cup “Group of Deaths” to regular groups and see how often the favorites go home.
However, the format of the tournament has changed dramatically throughout the years, so I decided to only focus on World Cup finals with at least 24 teams for the following reasons:
- They all feature a single group stage, which was not always the case in the earlier editions of soccer World Cup.
- With 16 or fewer teams qualifying for the World Cup, every group is by definition very close because only the best of the best make it.
This condition left me with a nice list of 11 tournaments (between 1982 and 2012). Unfortunately, I couldn’t use all of them since the FIFA Rankings were introduced in 1992. There have been 8 tournaments since, which is not the biggest sample size, but it’s not insignificant either.
The next step was to determine one “Group of Death” for each tournament. This was probably the most challenging part of this entire experiment, so I decided to use two different methods as follows:
-
FIFA Rankings: I used the official FIFA Rankings that have been around since 1992, so that covers 8 of the 11 tournaments that meet the criteria. For this study, I used the ratings in the last month before the start of each tournament and labeled “Group of Death” the group with the highest mean rating.
-
Public Perception: since the whole “Group of Death” concept was born out of discussions between fans, pundits, and soccer experts, I decided to include this method as well. I looked at media publications, public statements on TV broadcasts, Wikipedia, and online forums like Reddit for newer editions of the World Cup finals. Essentially, I figured out what the fans and experts perceived as the “Group of Death” before the start of each tournament.
I tested the “Group of Death” cliché with both approaches to get a more complex answer on whether this phenomenon is real.
Cross-Method Comparison
Here’s what group was selected as the “Group of Death” based on the two methods.
| Year | FIFA pick | Media pick(s) |
|---|---|---|
| 1994 | Group E | — |
| 1998 | Group G | Group D |
| 2002 | Group F | Group F |
| 2006 | Group E | Group C |
| 2010 | Group D | Group G |
| 2014 | Group D | Group G |
| 2018 | Group E | Group F |
| 2022 | Group B | Group E |
As you can see, there were major differences in both methods! The interesting part is that they both worked, so for betting purposes, you should probably go for both when preparing.
Here’s an overview of how the favorites performed for each tournament included.
FIFA Rankings
| Year | Group of Death | Main Favorite | Eliminated? | Secondary Favorite | Eliminated? |
|---|---|---|---|---|---|
| 1994 | Group E | Italy | No | Norway | Yes |
| 1998 | Group G | England | No | Colombia | Yes |
| 2002 | Group F | Argentina | Yes | England | No |
| 2006 | Group E | Czech Republic | Yes | United States | Yes |
| 2010 | Group D | Germany | No | Serbia | Yes |
| 2014 | Group D | Uruguay | No | Italy | Yes |
| 2018 | Group E | Brazil | No | Switzerland | No |
| 2022 | Group B | England | No | United States | No |
Public Perceipton
| Year | Group of Death | Main Favorite | Eliminated? | Secondary Favorite | Eliminated? |
|---|---|---|---|---|---|
| 1998 | Group D | Spain | Yes | Paraguay | No |
| 2002 | Group F | Argentina | Yes | England | No |
| 2006 | Group C | Netherlands | No | Argentina | No |
| 2010 | Group G | Brazil | No | Portugal | No |
| 2014 | Group G | Germany | No | Portugal | Yes |
| 2018 | Group F | Germany | Yes | Mexico | No |
| 2022 | Group E | Spain | No | Germany | Yes |
Conclusion: “Group of Deaths” Are the Real Deal!
Both methods I picked prove that World Cup “Group of Deaths” are the real deal! Of course, you should take this with a grain of salt, as the sample size is small. Still, it looks like the public and FIFA Rankings don’t lie.
What does that mean for the 2026 World Cup? Honestly, not much as the format has changed significantly. There’s no true “Group of Death” this time around because we have more teams and 8/12 third-placed teams will progress to the knockouts.
Does that mean that “Group of Deaths” are actually dead? I guess we’re about to find out soon!


You must be logged in to comment. Don't have an account? Sign up today.